Difference between revisions of "9th Discussion-28 October 2010"
| (14 intermediate revisions by 5 users not shown) | |||
| Line 5: | Line 5: | ||
Before committing significant time and resources to interpret the data pouring from high throughput sequencers it is important to check the quality and usability of the raw data. Knowing about potential problems in your data can help you to either correct for these before going on to do further analysis, or can take them into account when interpreting results you later derive. | Before committing significant time and resources to interpret the data pouring from high throughput sequencers it is important to check the quality and usability of the raw data. Knowing about potential problems in your data can help you to either correct for these before going on to do further analysis, or can take them into account when interpreting results you later derive. | ||
| − | As core facilities we are exposed to a wider variety of data than any individual research group and may have a better feel for how to spot potential problems, hence we are in a favorable position to develop best | + | As core facilities we are exposed to a wider variety of data than any individual research group and may have a better feel for how to spot potential problems, hence we are in a favorable position to develop best practices and measures to ensure the analysis and the results are meaningful. |
In this session we will aim to look at the way people are currently assessing their data quality. We will look at: | In this session we will aim to look at the way people are currently assessing their data quality. We will look at: | ||
| Line 11: | Line 11: | ||
* The type of problems which occur during sequencing experiments | * The type of problems which occur during sequencing experiments | ||
| − | * The | + | * The metrics for quality control |
| − | * The cutoffs to identify poor data | + | * The cutoffs to identify or filter poor data |
| − | * False positives | + | * False positives sources |
* Which software packages are being used | * Which software packages are being used | ||
| Line 22: | Line 22: | ||
=== The type of problems which occur during sequencing experiments === | === The type of problems which occur during sequencing experiments === | ||
| − | * Poor sequencing experiment | + | * Poor and failed sequencing experiment |
** Quality which drops off evenly over the course of a run | ** Quality which drops off evenly over the course of a run | ||
** Poor quality which affects only a subset of sequences | ** Poor quality which affects only a subset of sequences | ||
| Line 31: | Line 31: | ||
** Primers / Adapters | ** Primers / Adapters | ||
** Repeats / Low Complexity | ** Repeats / Low Complexity | ||
| + | ** Ribosomal RNA | ||
** Other samples | ** Other samples | ||
* Base call bias | * Base call bias | ||
** Bias affecting the whole run | ** Bias affecting the whole run | ||
** Bias affecting certain base positions | ** Bias affecting certain base positions | ||
| − | * Switched samples | + | * Switched samples or wrong labeling |
| − | === | + | === The metrics for quality control === |
* Quality plots | * Quality plots | ||
| Line 49: | Line 50: | ||
* Contaminant identification | * Contaminant identification | ||
** Overrepresented sequences | ** Overrepresented sequences | ||
| + | ** Overrepresented k-mers | ||
** Duplicate levels | ** Duplicate levels | ||
* Mapping quality | * Mapping quality | ||
| + | ** Overall error rate based on Phi-X alignment | ||
** Genomic distribution | ** Genomic distribution | ||
| + | ** Reference genome selection | ||
| + | ***Version | ||
| + | ***EST/Unigene | ||
| − | === | + | |
| + | === False positives sources === | ||
* Quality plots | * Quality plots | ||
** Biased sequence in illumina libraries | ** Biased sequence in illumina libraries | ||
| + | ** Biased in different sample preparation protocols | ||
* Composition plots | * Composition plots | ||
** Bisulphite conversion | ** Bisulphite conversion | ||
| Line 69: | Line 77: | ||
** Repeats | ** Repeats | ||
* Genomic distribution | * Genomic distribution | ||
| + | ** haplotypes | ||
** Sex chromosomes | ** Sex chromosomes | ||
** Mitochondria | ** Mitochondria | ||
| Line 78: | Line 87: | ||
* [http://hannonlab.cshl.edu/fastx_toolkit/ FastX toolkit] | * [http://hannonlab.cshl.edu/fastx_toolkit/ FastX toolkit] | ||
* [http://www-huber.embl.de/users/anders/HTSeq/doc/qa.html HTSeq QC scripts] | * [http://www-huber.embl.de/users/anders/HTSeq/doc/qa.html HTSeq QC scripts] | ||
| + | * [http://solexaqa.sourceforge.net/ SolexaQA] | ||
| + | * [http://genome.gsc.riken.jp/osc/english/dataresource/ TagDust] | ||
== Examples == | == Examples == | ||
| Line 87: | Line 98: | ||
[[Image:Gradual quality drop.png]] | [[Image:Gradual quality drop.png]] | ||
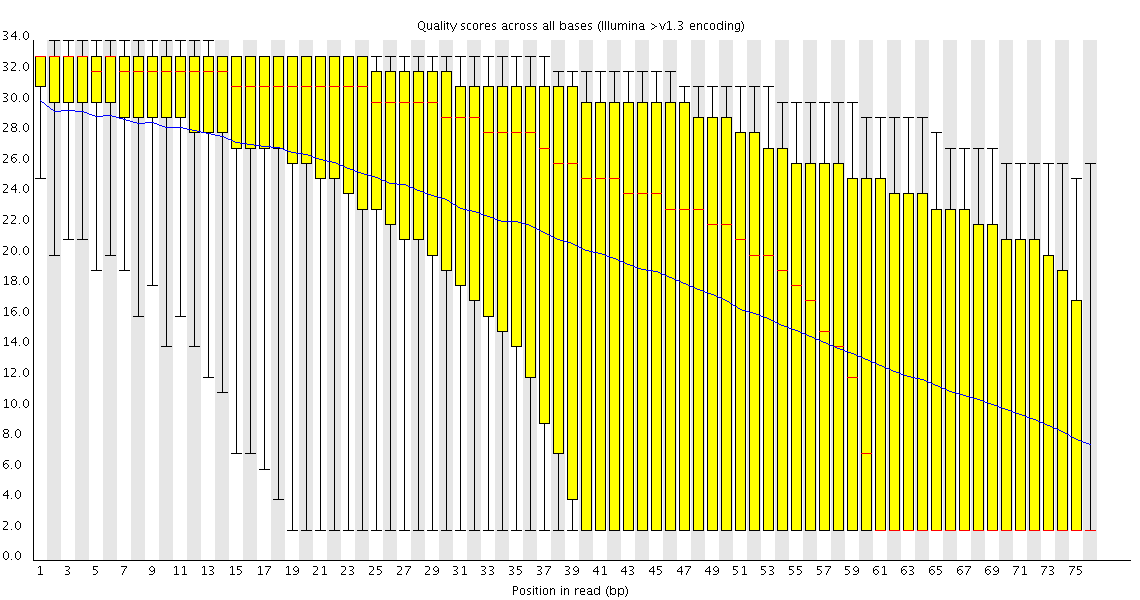
| − | This plot shows a common problem, especially with longer runs, which is that as the run progresses the quality of the calls gradually drops. Newer chemistry has improved this somewhat, but people are now doing even longer reads than ever. We'd normally say | + | This plot shows a common problem, especially with longer runs, which is that as the run progresses the quality of the calls gradually drops. Newer chemistry has improved this somewhat, but people are now doing even longer reads than ever. We'd normally say that when the median quality is dropping to a phred score of ~20 that we'd consider trimming the sequence at that point, since sequence with lower quality than that is likely to cause more problems than it fixes. |
[[Image:Sudden quality drop.png]] | [[Image:Sudden quality drop.png]] | ||
| Line 118: | Line 129: | ||
The above plot shows a GC profile of all of the sequences in a library. In this case the library was supposed to be human, which would produce a library with a median GC content of ~42%, however you can see that the median GC content for this sample is 44-45%. This may seem like a small shift, but GC profiles are remarkably stable and even a minor deviation indicates that there is a problem in the library. In this case the sequence actually came from a bacterium. | The above plot shows a GC profile of all of the sequences in a library. In this case the library was supposed to be human, which would produce a library with a median GC content of ~42%, however you can see that the median GC content for this sample is 44-45%. This may seem like a small shift, but GC profiles are remarkably stable and even a minor deviation indicates that there is a problem in the library. In this case the sequence actually came from a bacterium. | ||
| + | |||
| + | === ribosomal RNA (rRNA) contamination === | ||
| + | |||
| + | The Problem: Only 10.81% of reads mapped to the transcriptome. This is in contrast to 63.44% of reads from a different tissue sample from the same non-model organism, mapping to the same transcriptome. | ||
| + | *Sequencing experiment metrics | ||
| + | The run produced 27,032,861 SE40 sequences. % PF Clusters was 72.37 +/- 1.85. Quality trimming did not indicate any problem: 98.74% of the reads were of good quality (at least 20 bases of Sanger q20), and 25,342,800 reads (93.75%) were full length (40 bases). | ||
| + | |||
| + | *Read Mapping: The reads were mapped to a transcriptome set of cDNA sequences (fasta file) provided by the researcher. Mapping was performed using bwa aln and samse (default parameters) and pileup generated using samtools (default parameters). | ||
| + | |||
| + | *Steps Taken to Understand/Resolve the Problem: | ||
| + | ** The bwa and samtools mapping and counting steps were re-run to ensure that no computational error had taken place. This produced the same results. | ||
| + | ** The reads were then mapped to the draft genome of this non-model organism. 52.82% of the reads mapped to the genome. This indicated that a large percentage of the reads were from this organism (rather than contamination from another organism), but that the sequences were not represented in the transcriptome (cDNA fasta file) | ||
| + | ** The reads were then assembled. The assembly produced 147 contigs with coverage data. The consensus sequences for the 10 contigs with highest coverage were blasted (blastn) against the NCBI nt database. All hits were to ribosomal RNA. | ||
| + | |||
| + | * Experimental troubles before sequencing: This problem involved one lane of Illumina GAII sequence. Per the DNA Sequencing Core (Charlie Nicolet), the original total RNA sample was of very low concentration (very dilute). The first attempt at library construction failed, and the second attempt succeeded, but was difficult to complete. | ||
| + | |||
| + | === Illimina adaptor contamination === | ||
| + | |||
| + | Sometime the sequences from Illumina contain partial Illumina adapters' sequences. If not trimmed, they may affect significantly the assembly and mapping outcomes . | ||
| + | |||
| + | Adapter Sequences: | ||
| + | 5' AATGATACGGCGACCACCGA GATCTACACTCTTTCCCTAC ACGACGCTCTTCCGATCT (N) [[AGATCGGAAGAG]]CGGTTCAG CAGGAATGCCGAGACCGATC TCGTATGCCGTCTTCTGCTT G 3' | ||
| + | 3' TTACTATGCCGCTGGTGGCT CTAGATGTGAGAAAGGGATG TGCTGC[[GAGAAGGCTAGA]] (N) TCTAGCCTTCTCGCCAAGTC GTCCTTACGGCTCTGGCTAG AGCATACGGCAGAAGACGAA C 5' | ||
| + | |||
| + | |||
| + | [[Image:adapterContamination.jpg]] | ||
| + | |||
| + | This kind of adapter contamination can be detected using an analysis of Kmer enrichment in your library. Kmers showing a rise towards the end of the library indicate progressive contamination with adapters. | ||
| + | |||
| + | [[Image:Kmer_profiles.png]] | ||
| + | |||
| + | === GGCxG motif === | ||
| + | |||
| + | GGCxG or even GGC motif in the 5' to 3' direction of reads. Simply put: at some places, base calling after a GGCxG or GGC motif is particularly error prone, the number of reads without errors declines markedly. Repeated GGC motifs worsen the situation. | ||
| + | |||
| + | See [http://mira-assembler.sourceforge.net/docs/DefinitiveGuideToMIRA.html#sect_sxa_lowlights_GGCxG_motif http://mira-assembler.sourceforge.net/docs/DefinitiveGuideToMIRA.html#sect_sxa_lowlights_GGCxG_motif] | ||
| + | |||
| + | (Will port images to Wiki later) | ||
| + | |||
| + | === Sequencing bias towards lower GC === | ||
| + | |||
| + | See [http://mira-assembler.sourceforge.net/docs/DefinitiveGuideToMIRA.html#sect_sxa_lowlights_gcbias http://mira-assembler.sourceforge.net/docs/DefinitiveGuideToMIRA.html#sect_sxa_lowlights_gcbias] | ||
| + | |||
| + | (Will port images to Wiki later) | ||
=Transcript of Minutes= | =Transcript of Minutes= | ||
| − | ''' | + | |
| + | Attendees: | ||
| + | |||
| + | * Bastien Chevreux | ||
| + | * Julie Zhu | ||
| + | * Ben Davies | ||
| + | * Noelia Conservitie | ||
| + | * David Sexton | ||
| + | * Brent Richter | ||
| + | * ?? Hoffmann | ||
| + | * Fran Lewitter | ||
| + | * Joe Anderson | ||
| + | * David LaPoint | ||
| + | * Jeff Broady | ||
| + | * Stuart Levine | ||
| + | * Mirian ?? | ||
| + | * Tom Skelly | ||
| + | * Simon Andrews | ||
| + | * Dawei Lin | ||
| + | |||
| + | After an initial run through of the prepared notes for the session it appeared that lots of people had hit the same technical problems with their high throughput sequencing experiments. There seemed to be agreement that that monitoring the quality of raw sequence was important for spotting technical problems and also for evaluating downstream analyses. It was felt that the Bioinfo-core group was in a unique position to see a broad range of data and to get a perspective on quality that most groups would not be able to see. | ||
| + | |||
| + | With regards to the examples which had been posted in advance of the meeting it was felt that there weren't any major types of problem which had been omitted. One comment was that for the examples it would have been useful to tag them with the name of the technology used and the type of experiment to be able to put them in some context. | ||
| + | |||
| + | There was some discussion about whether a control lane was still necessary. Most people who commented said that they still felt it important to have a control on the flowcell, and most were still running a control lane. One group said that they now routinely run without a control lane, but that they occasionally have to rerun the base calling (Bustard) using a specified control lane if they get failed or biased samples on their flowcell. The new Illumina recommendation is to spike PhiX into each lane, and it was pointed out that whilst this provides a positive control for the sequencing it can't be used to construct the base matrices from which the base calls are made. For really biased libraries (above ~75% AT or GC) a dedicated, evenly biased, control is still needed. | ||
| + | |||
| + | One bias which some people have observed related to %GC. The observation was that a higher than expected proportion of reads came from sequences with a lower than average %GC. This didn't seem to be a universal problem so it wasn't clear whether this was a sequencing problem or something which occurred at the library construction stage. | ||
| + | |||
| + | A phenomenon which a few people had seen related to the calling of base positions which very low sequence diversity in the library. These seemed to be poorly handled by the Illumina platform, leading not only to a higher level of miscalls of the biased bases, but to a more general drop in base call quality for a few bases after the biased bases. The suspicion was that this was an artefact of the base calling algorithms rather than an inherent problem of the sequencing chemistry. | ||
| + | |||
| + | We then moved on to talk about the different software packages which people used for assessing the quality of their data. Most people are only running the QC which comes with the sequencing pipeline and don't add external QC verification. Lots of sites don't routinely return any QC data to the end user unless there has actually been an obvious problem. Where QC data is sent to the user it's normally the HTML summary report for the whole flowcell or the various set of plots (IVC, error rates etc) for the individual lanes. | ||
| + | |||
| + | Some groups are running external QC programs. The ones which were mentioned were: | ||
| + | |||
| + | * SolexaQA | ||
| + | * FastX | ||
| + | * ShortReadQA | ||
| + | * FastQC | ||
| + | |||
| + | The question was asked that when people have poor sequence quality do they actually trim their data. The consensus seemed to be that whether or not to do this would depend on the nature of the experiment. Mapping might be improved by keeping as much data as possible and letting the aligners deal with the poor quality, but SNP calls might just get confusing with a large volume of poor data. Some types of experiment (eg bisulfite seq) are very sensitive to miscalls and should definitely be trimmed. | ||
| + | |||
| + | One question which arose was whether anyone has looked at the accuracy of assigned quality scores. If you are mapping against a known reference genome then you could calibrate the actual error rate against the assigned qualities to see if they matched up. A few people said they would be interested to see this, but noone has done if yet. | ||
| + | |||
| + | We moved on to discuss contaminating sequences. A simple QC measure is to look for individual sequences which are overrepresented in the population and to try to match these to known sources of contamination. Many people write their own scripts for removing these kinds of contaminants. | ||
| + | |||
| + | One person asked if there was a good list of potential contaminants. Since there is one included in FastQC it was suggested that this be [[Sequence_Contaminant_List|posted to the wiki]] so people could see what was in there and add to it if they found their own. | ||
| + | |||
| + | In terms of trimming sequences FastX has a trimming option. SolexaQA can dynamically trim and can plot the results spatially over the area of a flowcell. | ||
| + | |||
| + | TagDust was suggested for trimming partial contaminant sequences from the end of reads. | ||
| + | |||
| + | One suggestion which was made was to look for the enrichment of Kmer sequences. This should spot overrepresented sequences whether or not they are aligned in the original reads. Looking at 5-7mers should give a good impression of any contamination. | ||
Latest revision as of 06:05, 19 November 2010
Contents
Brief Description and Continuing Discussion:
Assessing Sequence Data Quality (led by Dawei Lin and Simon Andrews)
Before committing significant time and resources to interpret the data pouring from high throughput sequencers it is important to check the quality and usability of the raw data. Knowing about potential problems in your data can help you to either correct for these before going on to do further analysis, or can take them into account when interpreting results you later derive.
As core facilities we are exposed to a wider variety of data than any individual research group and may have a better feel for how to spot potential problems, hence we are in a favorable position to develop best practices and measures to ensure the analysis and the results are meaningful.
In this session we will aim to look at the way people are currently assessing their data quality. We will look at:
- The type of problems which occur during sequencing experiments
- The metrics for quality control
- The cutoffs to identify or filter poor data
- False positives sources
- Which software packages are being used
Preliminary Information
To try to get the discussion started the information below sets out some existing tests and software packages which are already in use so we have a basis to start from.
The type of problems which occur during sequencing experiments
- Poor and failed sequencing experiment
- Quality which drops off evenly over the course of a run
- Poor quality which affects only a subset of sequences
- Poor quality which affects a run
- Overplated samples
- Underplated samples
- Sample contamination
- Primers / Adapters
- Repeats / Low Complexity
- Ribosomal RNA
- Other samples
- Base call bias
- Bias affecting the whole run
- Bias affecting certain base positions
- Switched samples or wrong labeling
The metrics for quality control
- Quality plots
- Per base
- Per sequence
- Intensity / Focus measures
- Composition plots
- Per base composition
- GC content
- GC profile
- Contaminant identification
- Overrepresented sequences
- Overrepresented k-mers
- Duplicate levels
- Mapping quality
- Overall error rate based on Phi-X alignment
- Genomic distribution
- Reference genome selection
- Version
- EST/Unigene
False positives sources
- Quality plots
- Biased sequence in illumina libraries
- Biased in different sample preparation protocols
- Composition plots
- Bisulphite conversion
- Genomes with extreme GC content
- Per base composition
- Bar codes
- Restriction sites
- ChIP-Seq
- RNA-Seq primers
- Contaminants
- Highly enriched sequences
- Repeats
- Genomic distribution
- haplotypes
- Sex chromosomes
- Mitochondria
- Biased ChIP
Which software packages are available
Examples
Look away now if you are of a nervous disposition. Below are a few examples of strange things which have been seen in real runs and a description of the cause, when known. It's worth noting that in nearly all cases usable data was able to be salvaged from these runs, after varying degrees of filtering, so bad QC is not a death sentence, just an invitation to work harder.
Poor Quality
This plot shows a common problem, especially with longer runs, which is that as the run progresses the quality of the calls gradually drops. Newer chemistry has improved this somewhat, but people are now doing even longer reads than ever. We'd normally say that when the median quality is dropping to a phred score of ~20 that we'd consider trimming the sequence at that point, since sequence with lower quality than that is likely to cause more problems than it fixes.
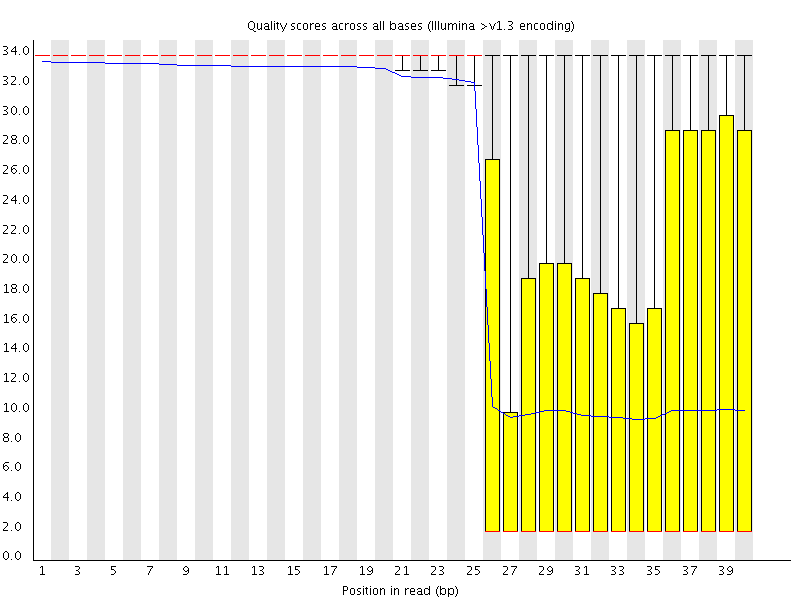
This plot shows a different kind of quality problem where the run suddenly switches from having very good quality to very poor quality. In this case there was a leak in the machine which covered the flowcell in salt about halfway through the run. Trimming the sequence actually meant that we recovered virtually a full run of usable data (since this was a ChIP-Seq run where the sequence was only used for mapping).
Biased Sequence
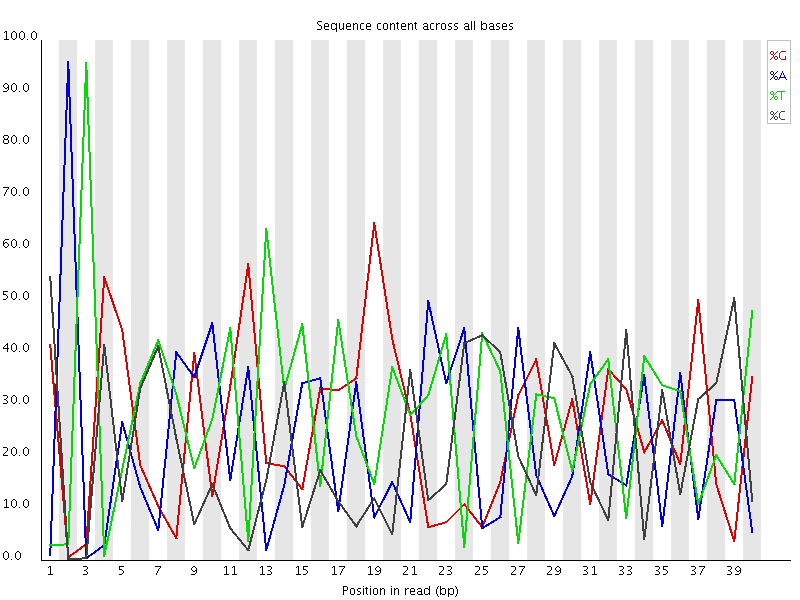
This plot actually shows two separate sources of bias. The first few bases show an extreme bias caused by the library having a restriction site on the front. The rest of the library shows a lower (but still very high) level of bias which comes from a single sequence which makes up ~20% of the library.
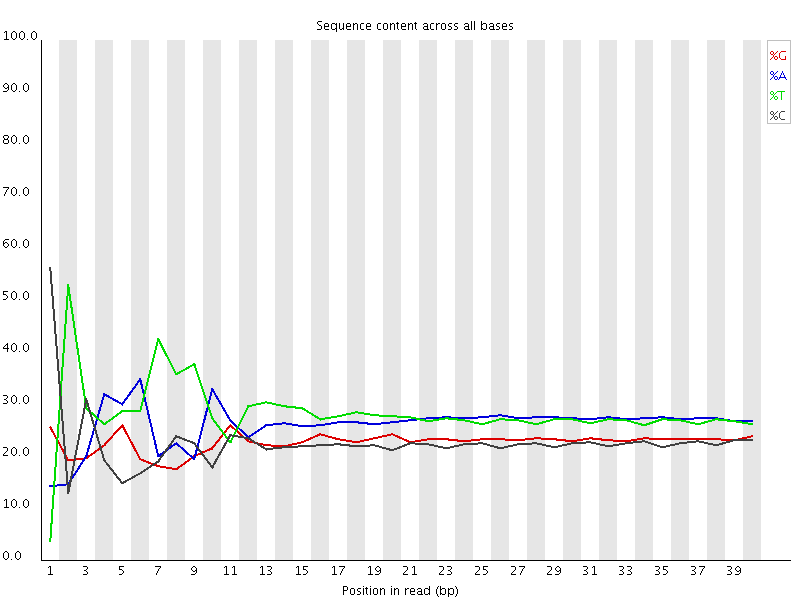
A lot of groups have found that RNA-Seq libraries created with Illumina kits show this odd bias in the first ~10 bases of the run. This seems to be due to the 'random' primers which are used in the library generation, which may not be quite as random as you'd hope. We've not removed this biased sequence and the results seem to be OK.
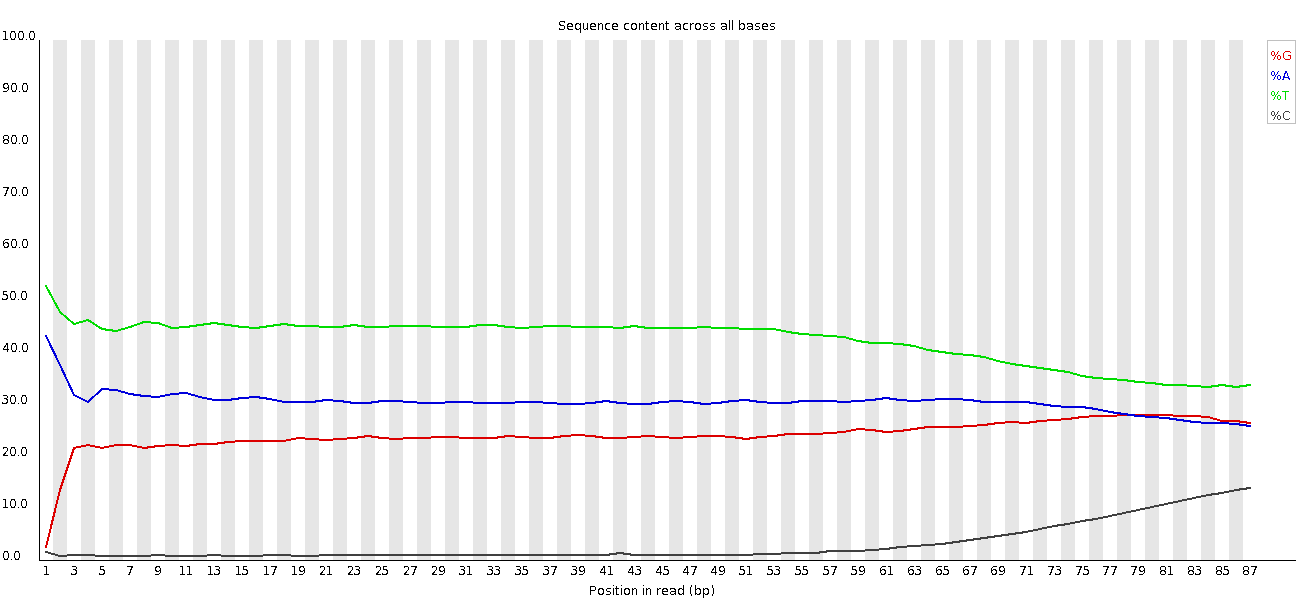
This shows an unusual experiment where the library was bisulphite converted, so the separation of G from C and A from T is expected. However you can see that as the run progresses there is an overall shift in the sequence composition. This correlated with a loss of sequencing quality so the suspicion is that miscalls get made with a more even sequence bias than bisulphite converted libraries. Trimming the sequences fixed this problem, but if this hadn't been done it would have had a dramatic effect on the methylation calls which were made.
Duplicated Sequence
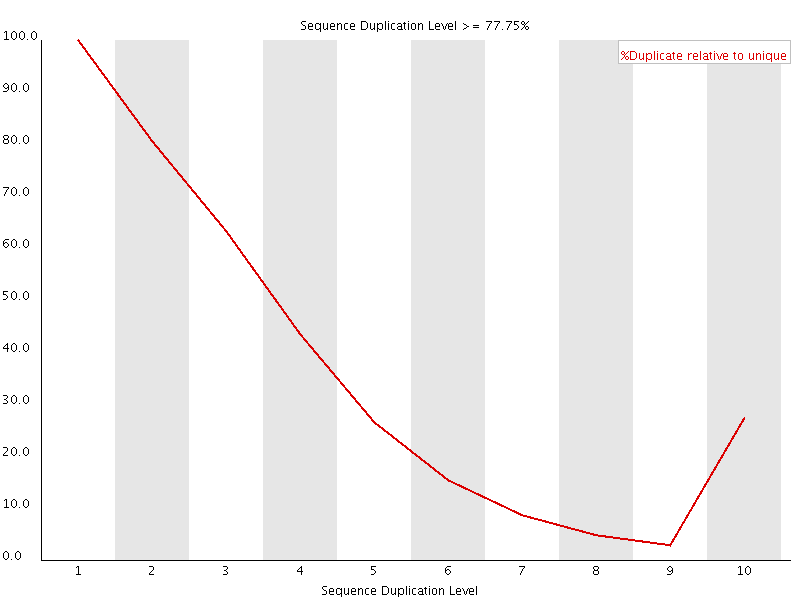
This plot shows the duplication levels for sequences in a library which had been over amplified. In a normal, diverse library you should see most sequences occurring only once. In this library you can see that the unique sequences make up only a small proportion of the library, with low level duplication accounting for most of the rest. Removing all duplicated reads from this library meant that usable data was able to be salvaged.
Wrong library
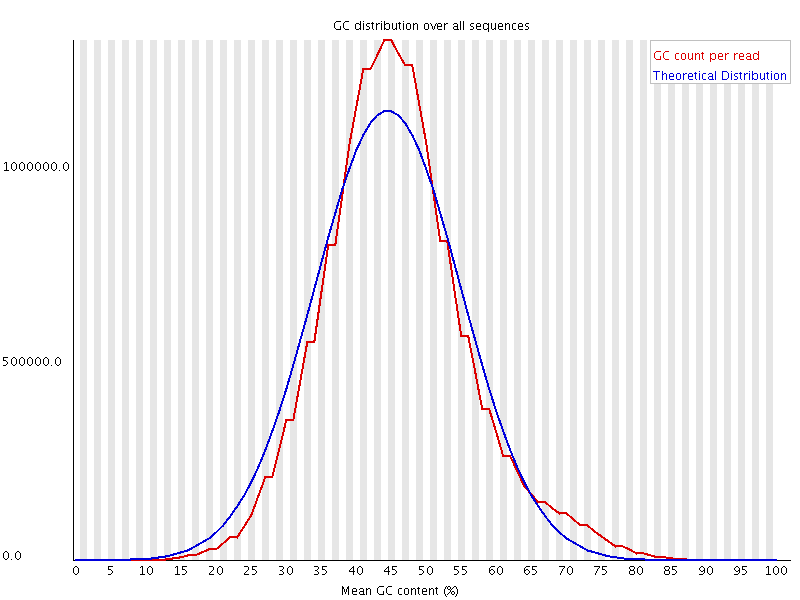
The above plot shows a GC profile of all of the sequences in a library. In this case the library was supposed to be human, which would produce a library with a median GC content of ~42%, however you can see that the median GC content for this sample is 44-45%. This may seem like a small shift, but GC profiles are remarkably stable and even a minor deviation indicates that there is a problem in the library. In this case the sequence actually came from a bacterium.
ribosomal RNA (rRNA) contamination
The Problem: Only 10.81% of reads mapped to the transcriptome. This is in contrast to 63.44% of reads from a different tissue sample from the same non-model organism, mapping to the same transcriptome.
- Sequencing experiment metrics
The run produced 27,032,861 SE40 sequences. % PF Clusters was 72.37 +/- 1.85. Quality trimming did not indicate any problem: 98.74% of the reads were of good quality (at least 20 bases of Sanger q20), and 25,342,800 reads (93.75%) were full length (40 bases).
- Read Mapping: The reads were mapped to a transcriptome set of cDNA sequences (fasta file) provided by the researcher. Mapping was performed using bwa aln and samse (default parameters) and pileup generated using samtools (default parameters).
- Steps Taken to Understand/Resolve the Problem:
- The bwa and samtools mapping and counting steps were re-run to ensure that no computational error had taken place. This produced the same results.
- The reads were then mapped to the draft genome of this non-model organism. 52.82% of the reads mapped to the genome. This indicated that a large percentage of the reads were from this organism (rather than contamination from another organism), but that the sequences were not represented in the transcriptome (cDNA fasta file)
- The reads were then assembled. The assembly produced 147 contigs with coverage data. The consensus sequences for the 10 contigs with highest coverage were blasted (blastn) against the NCBI nt database. All hits were to ribosomal RNA.
- Experimental troubles before sequencing: This problem involved one lane of Illumina GAII sequence. Per the DNA Sequencing Core (Charlie Nicolet), the original total RNA sample was of very low concentration (very dilute). The first attempt at library construction failed, and the second attempt succeeded, but was difficult to complete.
Illimina adaptor contamination
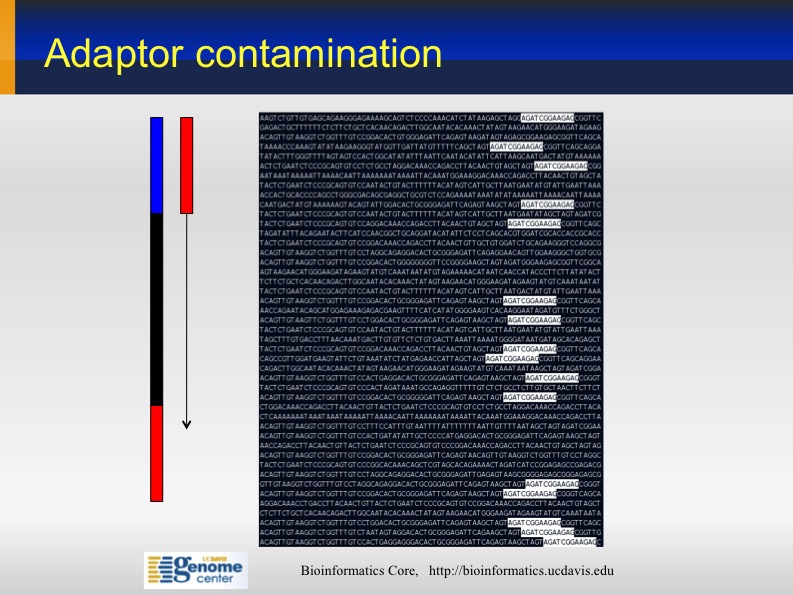
Sometime the sequences from Illumina contain partial Illumina adapters' sequences. If not trimmed, they may affect significantly the assembly and mapping outcomes .
Adapter Sequences: 5' AATGATACGGCGACCACCGA GATCTACACTCTTTCCCTAC ACGACGCTCTTCCGATCT (N) AGATCGGAAGAGCGGTTCAG CAGGAATGCCGAGACCGATC TCGTATGCCGTCTTCTGCTT G 3' 3' TTACTATGCCGCTGGTGGCT CTAGATGTGAGAAAGGGATG TGCTGCGAGAAGGCTAGA (N) TCTAGCCTTCTCGCCAAGTC GTCCTTACGGCTCTGGCTAG AGCATACGGCAGAAGACGAA C 5'
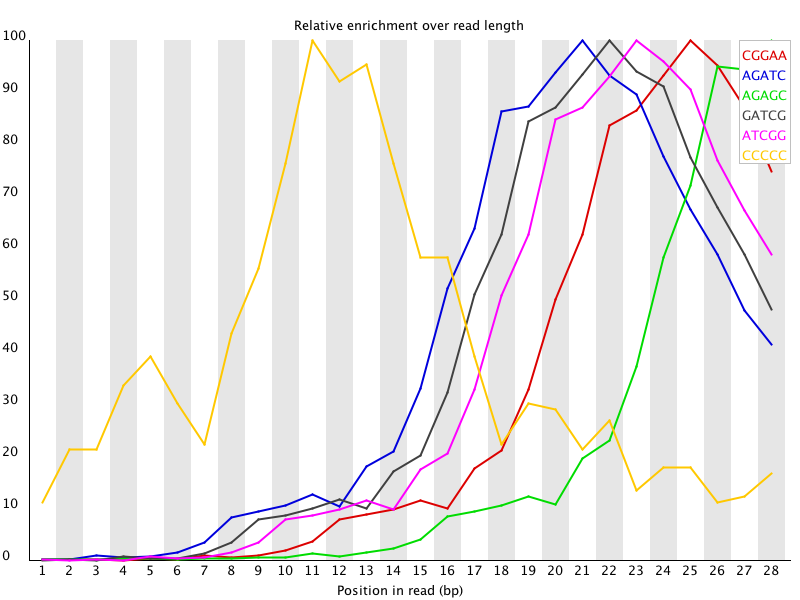
This kind of adapter contamination can be detected using an analysis of Kmer enrichment in your library. Kmers showing a rise towards the end of the library indicate progressive contamination with adapters.
GGCxG motif
GGCxG or even GGC motif in the 5' to 3' direction of reads. Simply put: at some places, base calling after a GGCxG or GGC motif is particularly error prone, the number of reads without errors declines markedly. Repeated GGC motifs worsen the situation.
See http://mira-assembler.sourceforge.net/docs/DefinitiveGuideToMIRA.html#sect_sxa_lowlights_GGCxG_motif
(Will port images to Wiki later)
Sequencing bias towards lower GC
See http://mira-assembler.sourceforge.net/docs/DefinitiveGuideToMIRA.html#sect_sxa_lowlights_gcbias
(Will port images to Wiki later)
Transcript of Minutes
Attendees:
- Bastien Chevreux
- Julie Zhu
- Ben Davies
- Noelia Conservitie
- David Sexton
- Brent Richter
- ?? Hoffmann
- Fran Lewitter
- Joe Anderson
- David LaPoint
- Jeff Broady
- Stuart Levine
- Mirian ??
- Tom Skelly
- Simon Andrews
- Dawei Lin
After an initial run through of the prepared notes for the session it appeared that lots of people had hit the same technical problems with their high throughput sequencing experiments. There seemed to be agreement that that monitoring the quality of raw sequence was important for spotting technical problems and also for evaluating downstream analyses. It was felt that the Bioinfo-core group was in a unique position to see a broad range of data and to get a perspective on quality that most groups would not be able to see.
With regards to the examples which had been posted in advance of the meeting it was felt that there weren't any major types of problem which had been omitted. One comment was that for the examples it would have been useful to tag them with the name of the technology used and the type of experiment to be able to put them in some context.
There was some discussion about whether a control lane was still necessary. Most people who commented said that they still felt it important to have a control on the flowcell, and most were still running a control lane. One group said that they now routinely run without a control lane, but that they occasionally have to rerun the base calling (Bustard) using a specified control lane if they get failed or biased samples on their flowcell. The new Illumina recommendation is to spike PhiX into each lane, and it was pointed out that whilst this provides a positive control for the sequencing it can't be used to construct the base matrices from which the base calls are made. For really biased libraries (above ~75% AT or GC) a dedicated, evenly biased, control is still needed.
One bias which some people have observed related to %GC. The observation was that a higher than expected proportion of reads came from sequences with a lower than average %GC. This didn't seem to be a universal problem so it wasn't clear whether this was a sequencing problem or something which occurred at the library construction stage.
A phenomenon which a few people had seen related to the calling of base positions which very low sequence diversity in the library. These seemed to be poorly handled by the Illumina platform, leading not only to a higher level of miscalls of the biased bases, but to a more general drop in base call quality for a few bases after the biased bases. The suspicion was that this was an artefact of the base calling algorithms rather than an inherent problem of the sequencing chemistry.
We then moved on to talk about the different software packages which people used for assessing the quality of their data. Most people are only running the QC which comes with the sequencing pipeline and don't add external QC verification. Lots of sites don't routinely return any QC data to the end user unless there has actually been an obvious problem. Where QC data is sent to the user it's normally the HTML summary report for the whole flowcell or the various set of plots (IVC, error rates etc) for the individual lanes.
Some groups are running external QC programs. The ones which were mentioned were:
- SolexaQA
- FastX
- ShortReadQA
- FastQC
The question was asked that when people have poor sequence quality do they actually trim their data. The consensus seemed to be that whether or not to do this would depend on the nature of the experiment. Mapping might be improved by keeping as much data as possible and letting the aligners deal with the poor quality, but SNP calls might just get confusing with a large volume of poor data. Some types of experiment (eg bisulfite seq) are very sensitive to miscalls and should definitely be trimmed.
One question which arose was whether anyone has looked at the accuracy of assigned quality scores. If you are mapping against a known reference genome then you could calibrate the actual error rate against the assigned qualities to see if they matched up. A few people said they would be interested to see this, but noone has done if yet.
We moved on to discuss contaminating sequences. A simple QC measure is to look for individual sequences which are overrepresented in the population and to try to match these to known sources of contamination. Many people write their own scripts for removing these kinds of contaminants.
One person asked if there was a good list of potential contaminants. Since there is one included in FastQC it was suggested that this be posted to the wiki so people could see what was in there and add to it if they found their own.
In terms of trimming sequences FastX has a trimming option. SolexaQA can dynamically trim and can plot the results spatially over the area of a flowcell.
TagDust was suggested for trimming partial contaminant sequences from the end of reads.
One suggestion which was made was to look for the enrichment of Kmer sequences. This should spot overrepresented sequences whether or not they are aligned in the original reads. Looking at 5-7mers should give a good impression of any contamination.
