9th Discussion-28 October 2010
Contents
Brief Description and Continuing Discussion (please edit in line):
Assessing Sequence Data Quality (led by Dawei Lin and Simon Andrews)
Before going on to analyse data coming from high throughput sequencers it is important to check the quality of the raw data. Knowing about potential problems in your data can help you to either correct for these before going on to do any analysis, or can take them into account when interpreting results you later derive.
Knowing what measures to usefully take from your data and how to interpret these can help enormously. As core facilities we are exposed to a wider variety of data than any individual research group and may have a better feel for how to spot potential problems.
In this session we will aim to look at the way people are currently assessing their data quality. We will look at:
- The type of errors which occur
- The best metrics to calculate
- The cutoffs to identify poor data
- False positives coming from different types of experiment
- Which software packages are being used
Preliminary Information
To try to get the discussion started the information below sets out some existing tests and software packages which are already in use so we have a basis to start from.
What type of problems occur
- Poor sequence quality
- Quality which drops off evenly over the course of a run
- Poor quality which affects only a subset of sequences
- Poor quality which suddenly affects a run
- Contamination
- Primers / Adapters
- Repeats / Low Complexity
- Other samples
- Base call bias
- Bias affecting the whole run
- Bias affecting certain base positions
- Switched samples
What metrics could we calculate
- Quality plots
- Per base
- Per sequence
- Intensity / Focus measures
- Composition plots
- Per base composition
- GC content
- GC profile
- Contaminant identification
- Overrepresented sequences
- Duplicate levels
- Mapping quality
- Genomic distribution
What are sources of false positives
- Quality plots
- Biased sequence in illumina libraries
- Composition plots
- Bisulphite conversion
- Genomes with extreme GC content
- Per base composition
- Bar codes
- Restriction sites
- ChIP-Seq
- RNA-Seq primers
- Contaminants
- Highly enriched sequences
- Repeats
- Genomic distribution
- Sex chromosomes
- Mitochondria
- Biased ChIP
Which software packages are available
Examples
Look away now if you are of a nervous disposition. Below are a few examples of strange things which have been seen in real runs and a description of the cause, when known. It's worth noting that in nearly all cases usable data was able to be salvaged from these runs, after varying degrees of filtering, so bad QC is not a death sentence, just an invitation to work harder.
Poor Quality
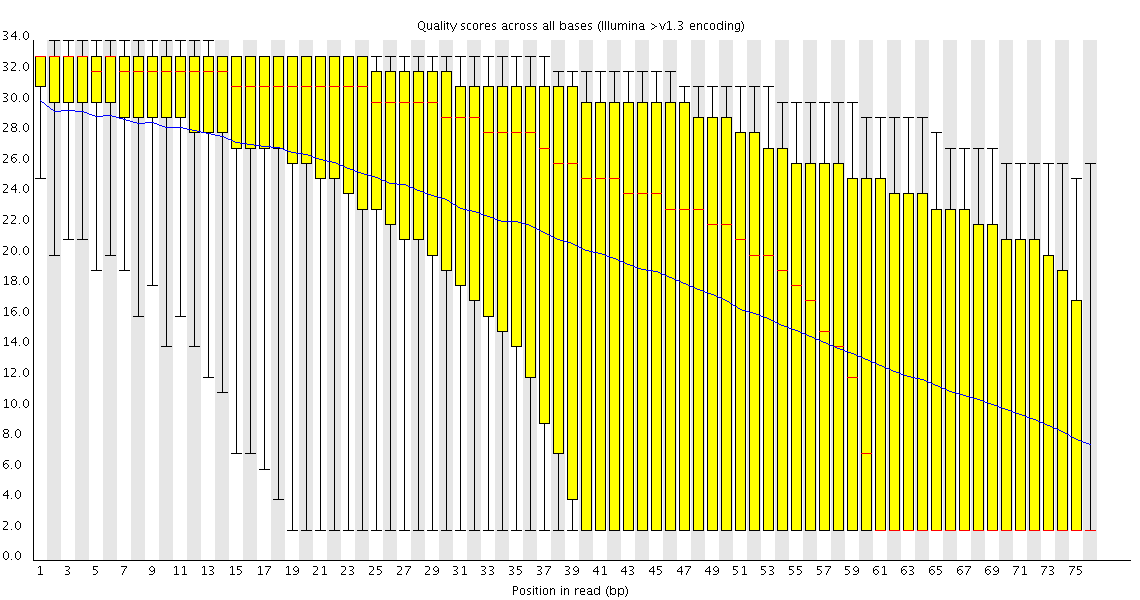
This plot shows a common problem, especially with longer runs, which is that as the run progresses the quality of the calls gradually drops. Newer chemistry has improved this somewhat, but people are now doing even longer reads than ever. We'd normally say than when the median quality is dropping to a phred score of ~20 that we'd consider trimming the sequence at that point, since sequence with lower quality than that is likely to cause more problems than it fixes.
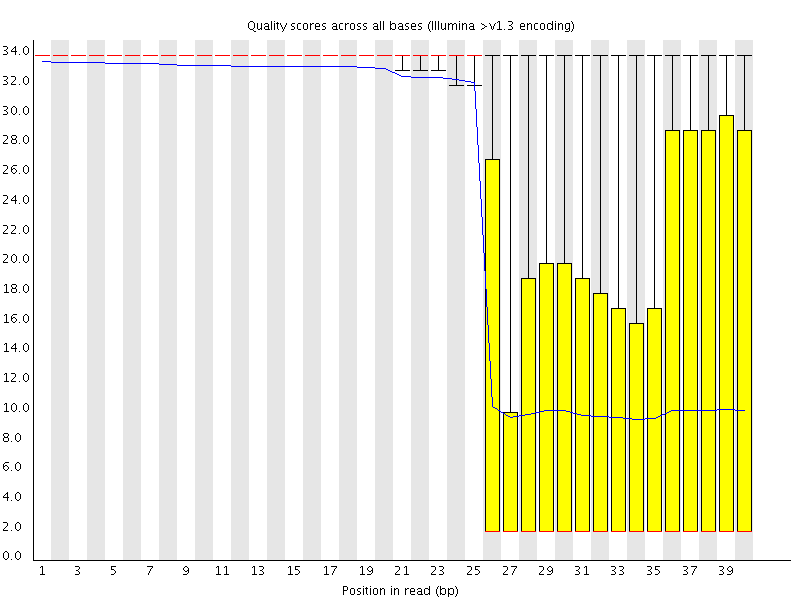
This plot shows a different kind of quality problem where the run suddenly switches from having very good quality to very poor quality. In this case there was a leak in the machine which covered the flowcell in salt about halfway through the run. Trimming the sequence actually meant that we recovered virtually a full run of usable data (since this was a ChIP-Seq run where the sequence was only used for mapping).
Biased Sequence
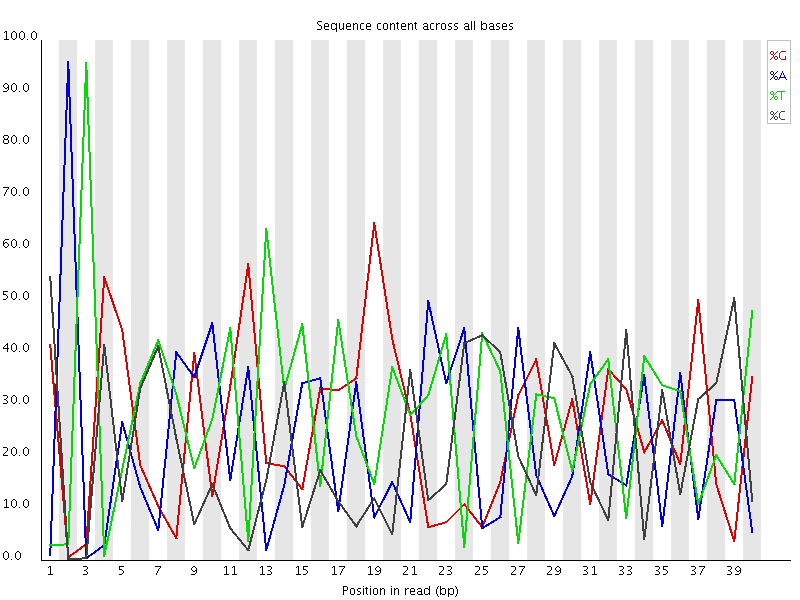
This plot actually shows two separate sources of bias. The first few bases show an extreme bias caused by the library having a restriction site on the front. The rest of the library shows a lower (but still very high) level of bias which comes from a single sequence which makes up ~20% of the library.
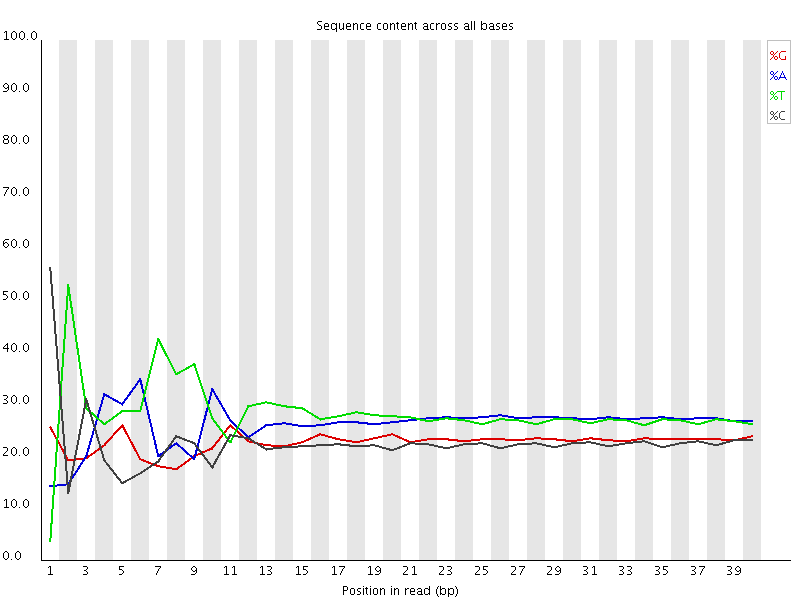
A lot of groups have found that RNA-Seq libraries created with Illumina kits show this odd bias in the first ~10 bases of the run. This seems to be due to the 'random' primers which are used in the library generation, which may not be quite as random as you'd hope. We've not removed this biased sequence and the results seem to be OK.
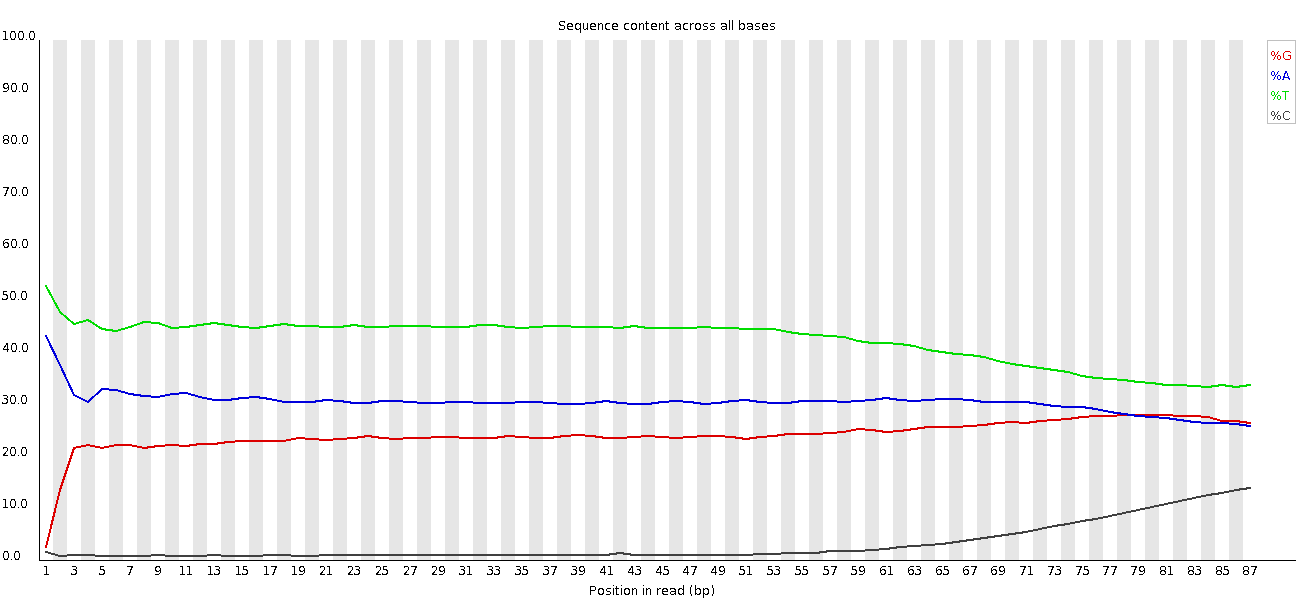
This shows an unusual experiment where the library was bisulphite converted, so the separation of G from C and A from T is expected. However you can see that as the run progresses there is an overall shift in the sequence composition. This correlated with a loss of sequencing quality so the suspicion is that miscalls get made with a more even sequence bias than bisulphite converted libraries. Trimming the sequences fixed this problem, but if this hadn't been done it would have had a dramatic effect on the methylation calls which were made.
Duplicated Sequence
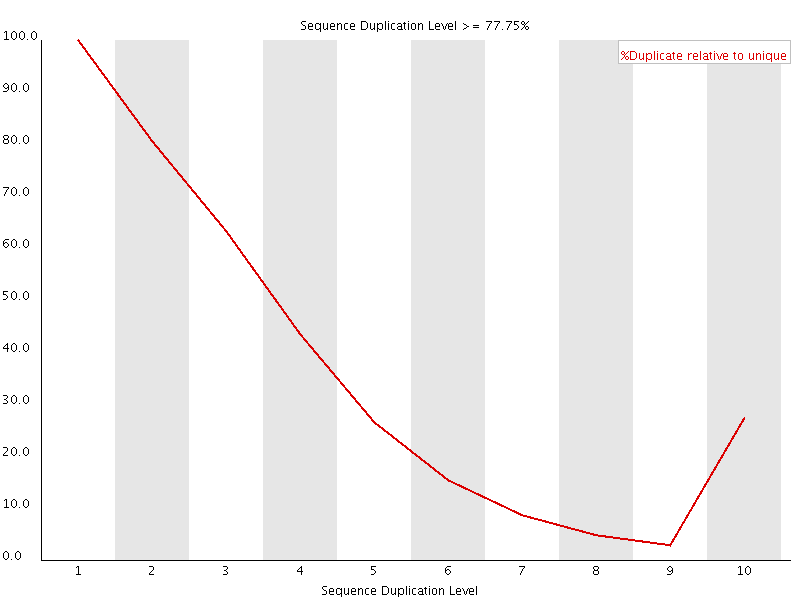
This plot shows the duplication levels for sequences in a library which had been over amplified. In a normal, diverse library you should see most sequences occurring only once. In this library you can see that the unique sequences make up only a small proportion of the library, with low level duplication accounting for most of the rest. Removing all duplicated reads from this library meant that usable data was able to be salvaged.
Wrong library
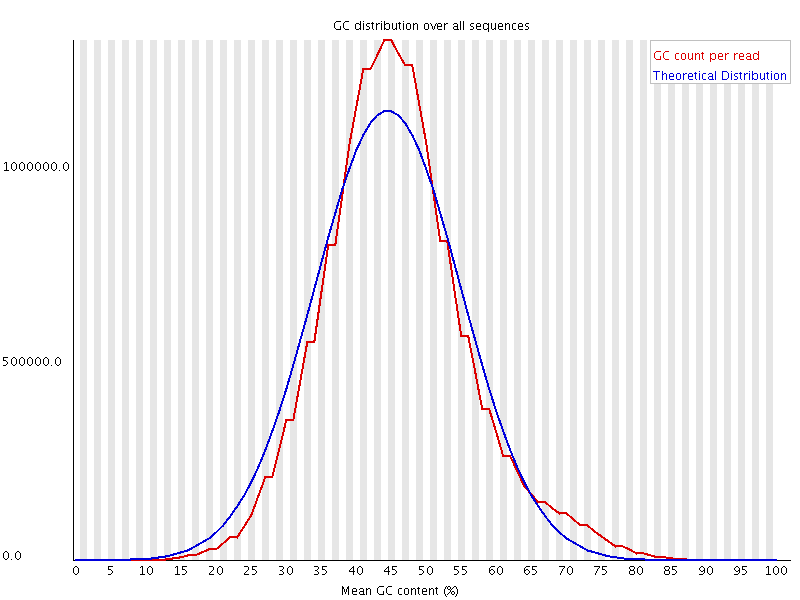
The above plot shows a GC profile of all of the sequences in a library. In this case the library was supposed to be human, which would produce a library with a median GC content of ~42%, however you can see that the median GC content for this sample is 44-45%. This may seem like a small shift, but GC profiles are remarkably stable and even a minor deviation indicates that there is a problem in the library. In this case the sequence actually came from a bacterium.
Transcript of Minutes
coming soon
